This summer, Connect2Capital introduced a new reporting section titled “Impact” to help lenders and referral partners glean additional insight into their lending trends on Connect2Capital.
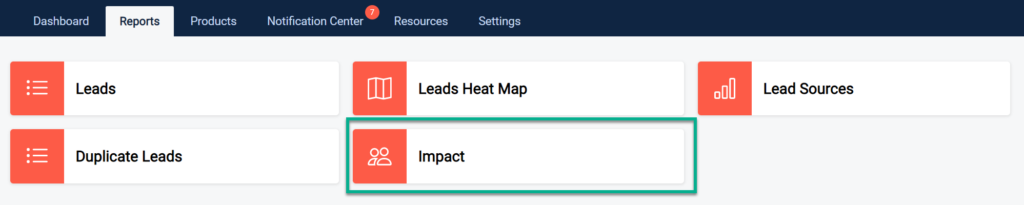
We know that platform partners on Connect2Capital are doing a tremendous job reaching small businesses owned by folks traditionally underrepresented in business lending ecosystems. The first report we created in this new section seeks to highlight this strength on our platform while also giving us and our partners insight into performance with specific groups. Specifically, this report enables partners to see the conversion rates and stage statuses by selected demographic groups.
Organization Specific Impact: Using the Report
Below is an in-depth explainer for how you can specifically use the impact reports various functionality.
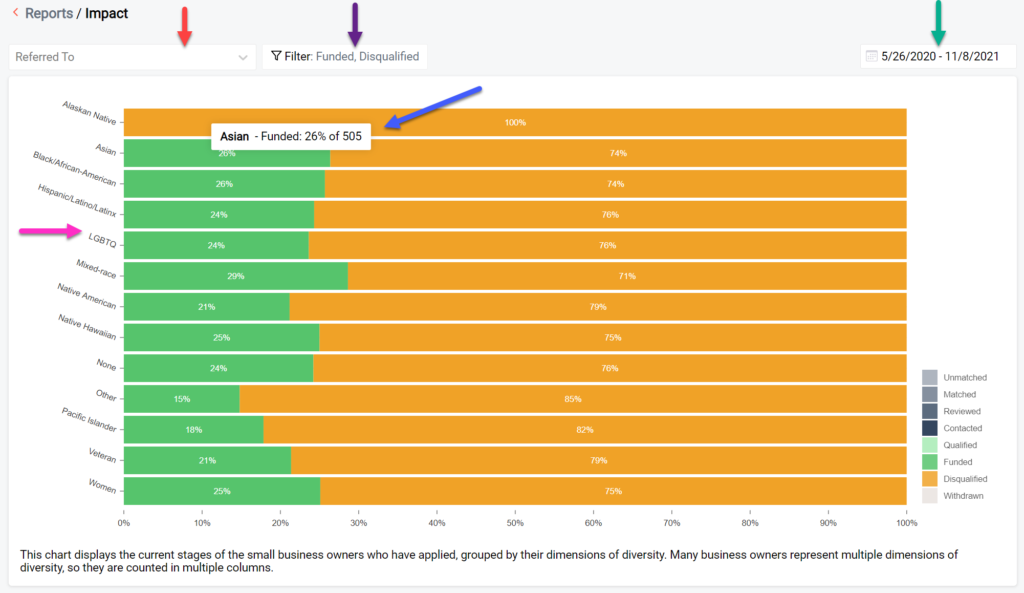
Purple Arrow: Selects date ranges for leads. Are you curious if a new marketing campaign has helped improve outcomes for a particular group? You can use the date picker to compare outcomes from different date ranges against each other.
Blue Arrow: Selects filters for businesses characteristics. Are you interested in seeing outcomes for specific types of businesses (ex: credit score, industry, years in business, revenue last year, revenue projected, stage in application process)? You can toggle filters to understand relative performance of any number of combinations of characteristics.
Green Arrow: Mouse over to understand sample sizes. Do you want to dig deeper beyond a top line percentage to understand how big of a sample goes into a category? Mouse over any bar to understand the raw number of applications that reflect this outcome.
Red Arrow: Filter data by lead source. Do you receive leads from multiple sources? (Example: SOAR Fund and New York Forward Loan Fund). Compare applicant outcomes from lead source to lead source to help understand where conversion rates are thriving and where they might be flagging.
Yellow Arrow: Compare applicant outcomes by demographic group. Are different underrepresented groups doing better or worse than others? Compare outcomes by underrepresented groups to evaluate whether existing efforts are working well or may need to be tweaked to improve outcomes.
The Connect2Capital team has also been using the platform wide version of this Impact report to understand platform wide outcomes. Given that our driving mission is to connect small businesses historically less likely to be able to secure loans with mission driven lenders, this report has helped us understand where we’re seeing success and where we have room for improvement. The data below is all actual information we want to share to help our partners understand a little more about Connect2Capital’s performance.
Platform-wide Impact Detail
Figure 1 shows outcomes for applicants who reach an eligibility decision stage with a lender, broken down by demographic group.
The platform wide loan conversion rate of this group is 20.5%, though there is some variation among demographic groups. For example, Native American applicants are converting at rates of just 10%, while Latinx borrowers and Asian borrowers are outperforming platform averages and converting at 23% and 24% respectively.
Importantly, these numbers don’t exist in a vacuum and don’t necessarily imply any lender or even the platform in general is failing any group of people. Institutional discrimination and generational, systemic exclusion from lending ecosystems means that borrowers from underrepresented groups are entering the eligibility review process at a disadvantage. That certain folks are converting at lower rates is unfortunately not entirely surprising. It’s also worth considering the relative sample size of various groups, as in cases such as this one applicants of Native American heritage are a numerically smaller pool and their outcomes are more likely to be skewed.
However, it’s worth monitoring trends and understanding what interventions may be more or less successful over time. As a platform, we’re thrilled to see most underrepresented groups performing roughly as well or better than people not from underrepresented groups, while also closely monitoring developments that could change such realities.
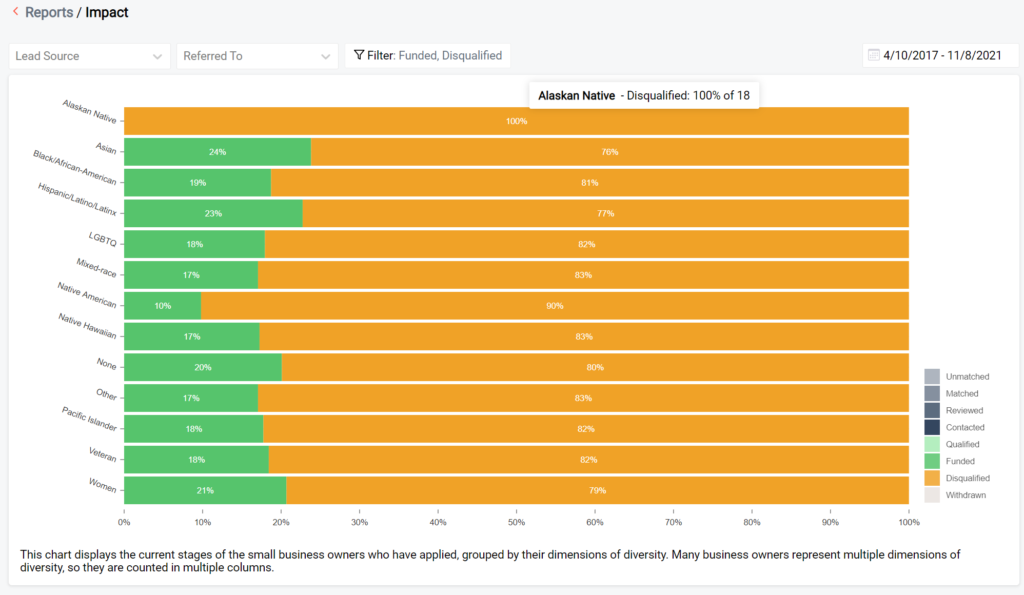
Withdrawn Leads — Additional Context
In figure 2, we examine Connect2Capital’s conversion rates among borrowers who have had eligibility decisions made OR who have withdrawn from loan consideration. The ease of the Connect2Capital’s preapplication is a tremendous strength, but also results in a high rate of completion for folks who may be just exploring their options without the intent to go through with a loan. We also know that some applicants can be harder to reach or unable to provide the necessary engagement or documents to ultimately receive a loan. Understanding whether certain groups of people are withdrawing from the process more or less often than platform averages can inform our outreach efforts.
Platform-wide, leads in this category are withdrawn at a rate of 52.8%. However, similar to Figure 1, we see slight variance among different groups of applicants. Women and Latinx applicants are withdrawing at rates of 47% and 46% respectively, while LGBTQ applicants withdraw at rates of 62%, for example.
As we were constructing this report, some members of the Connect2Capital team hypothesized that there might be an overrepresentation in the Withdrawn category of people from certain underrepresented groups who are more likely to be non-Native English speakers.
However, while systemic inequities do not universally evaporate on Connect2Capital, the platform appears to be doing a generally good job of evening the playing field for this group of applicants and most others.
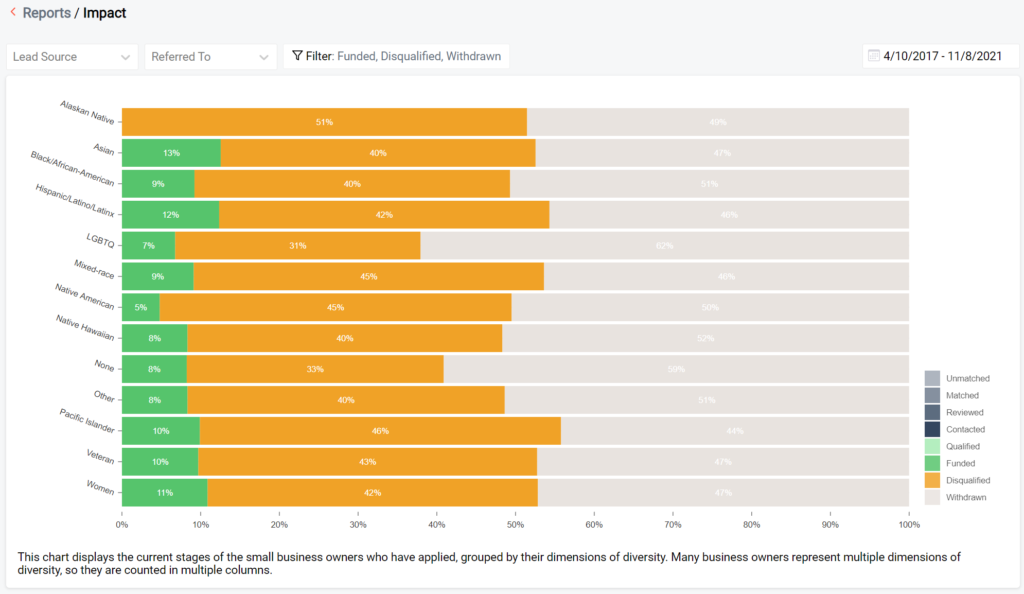
The last graph we want to share today details the Connect2Capital platform pipeline for small businesses with revenue under $250,000 last year. This reporting feature allows for incredibly nuanced combinations and data exploration. Figure 3 details the combination of boxes checked to produce the report in Figure 4.
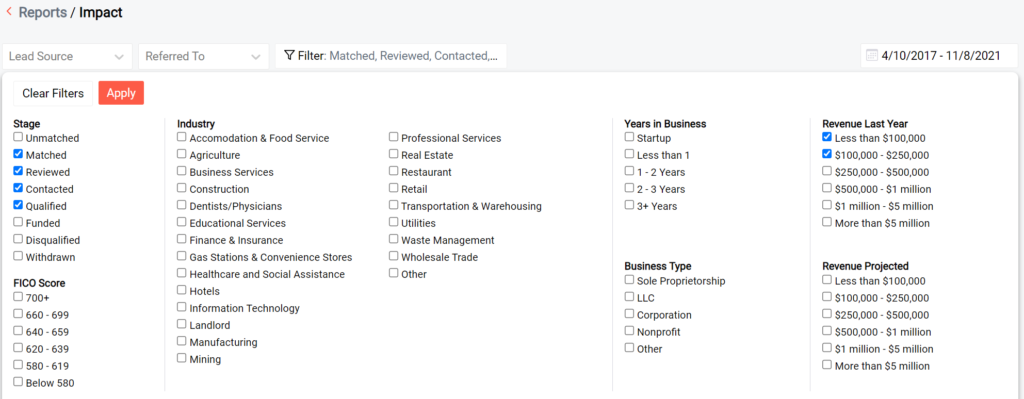
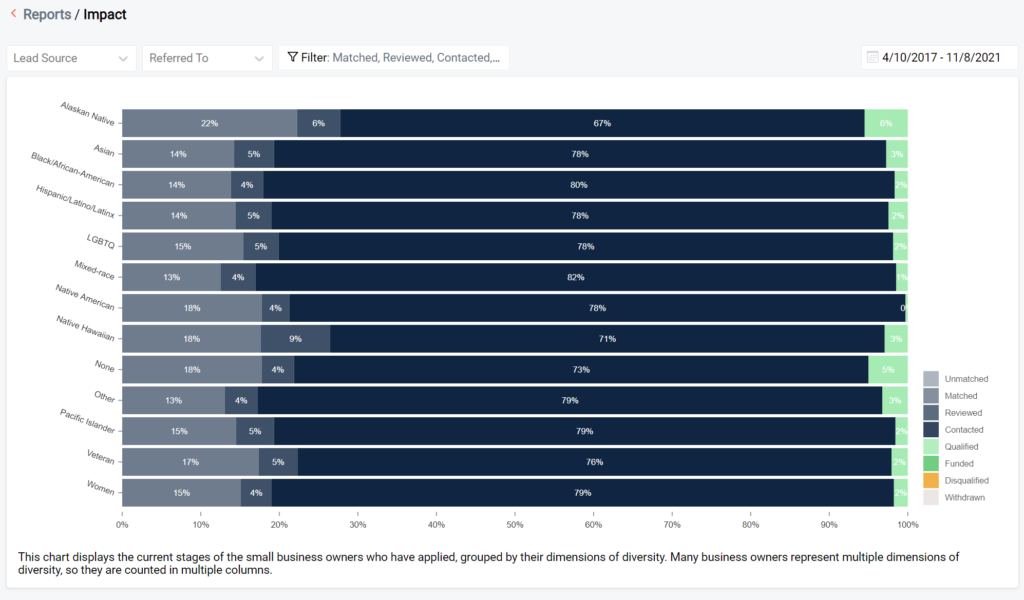
Among this group, the platform average for proportion of leads in the contacted stage and the matched stage is 76.1% and 16.5%, respectively. While we don’t necessarily see stark differences among demographic groups here, the sheer volume of pipeline leads in the contacted stage is very heartening to the C2C team. This graph helps us understand that in general, CDFIs and other service partners are doing a tremendous job reviewing leads and reaching out to applicants.
Ready to explore your organization’s Connect2Capital impact stats? Check out your Impact Report on your partner dashboard today.